OUR PLATFORM
Simple and Powerful Data Collection Software
Real-Time Data
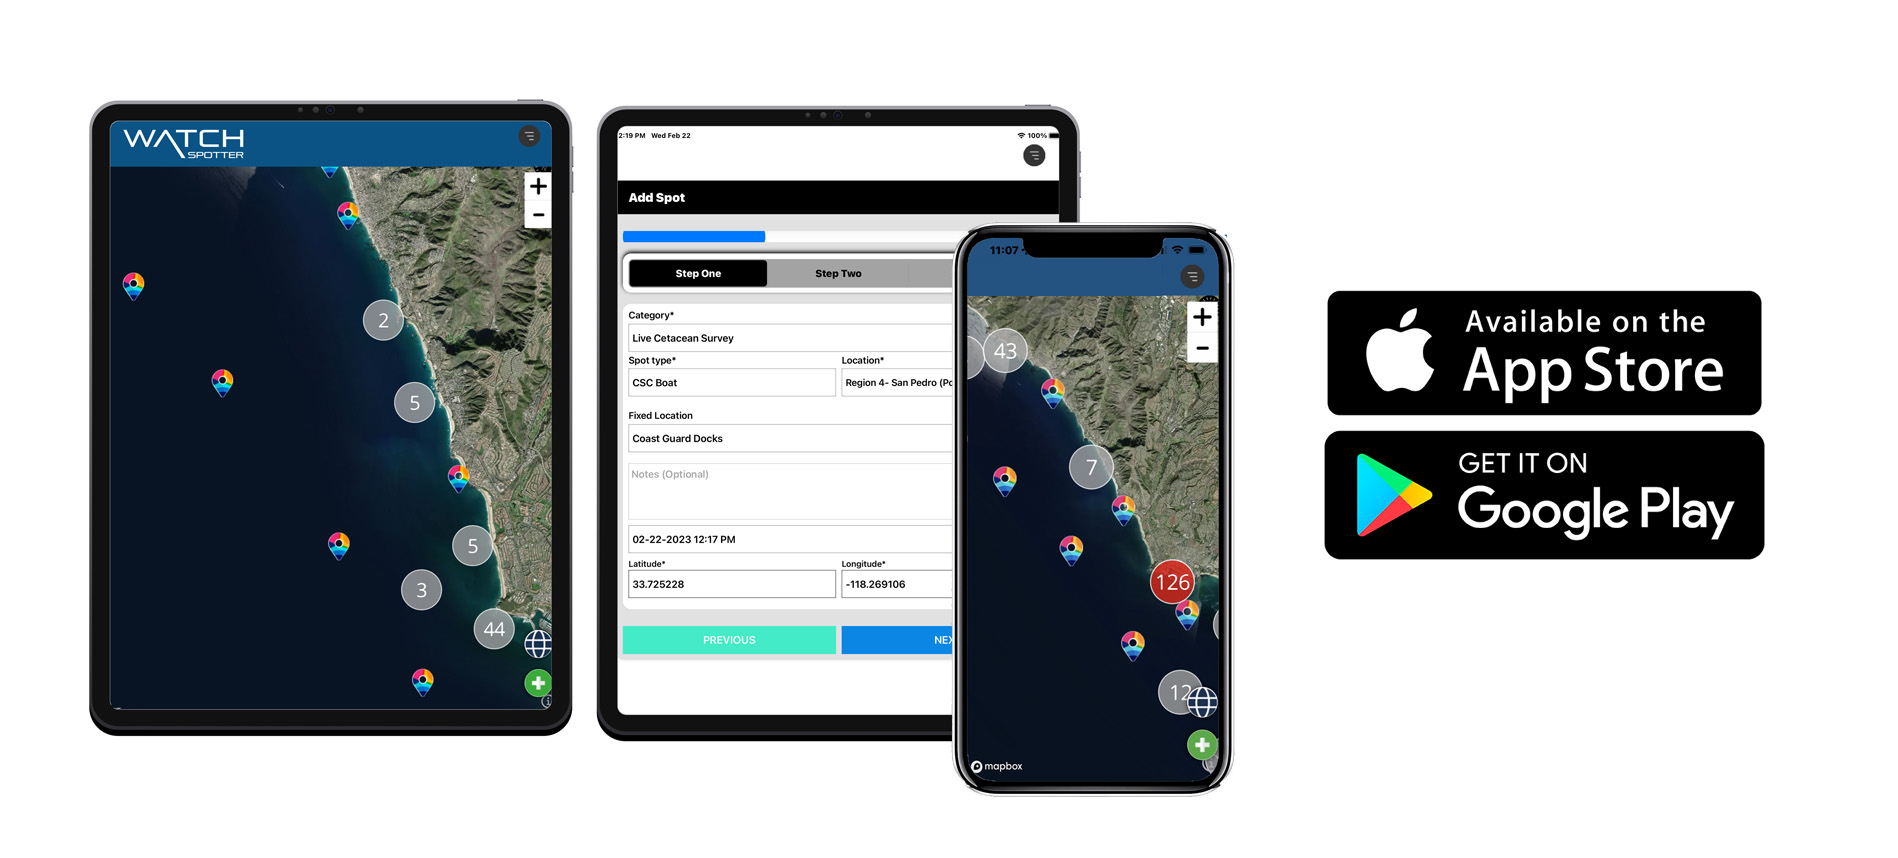
Real-time data capture and visualization are at the heart of our system. Users in the field can instantly submit observations through a user-friendly mobile app interface, ensuring that data is logged the moment it’s encountered. This immediacy of data entry is crucial for maintaining the integrity and relevance of the information. As soon as the data is submitted, it is geographically represented on a digital map, creating a live visual stream of information that can be tracked and analyzed as it happens.
Visualization Insights
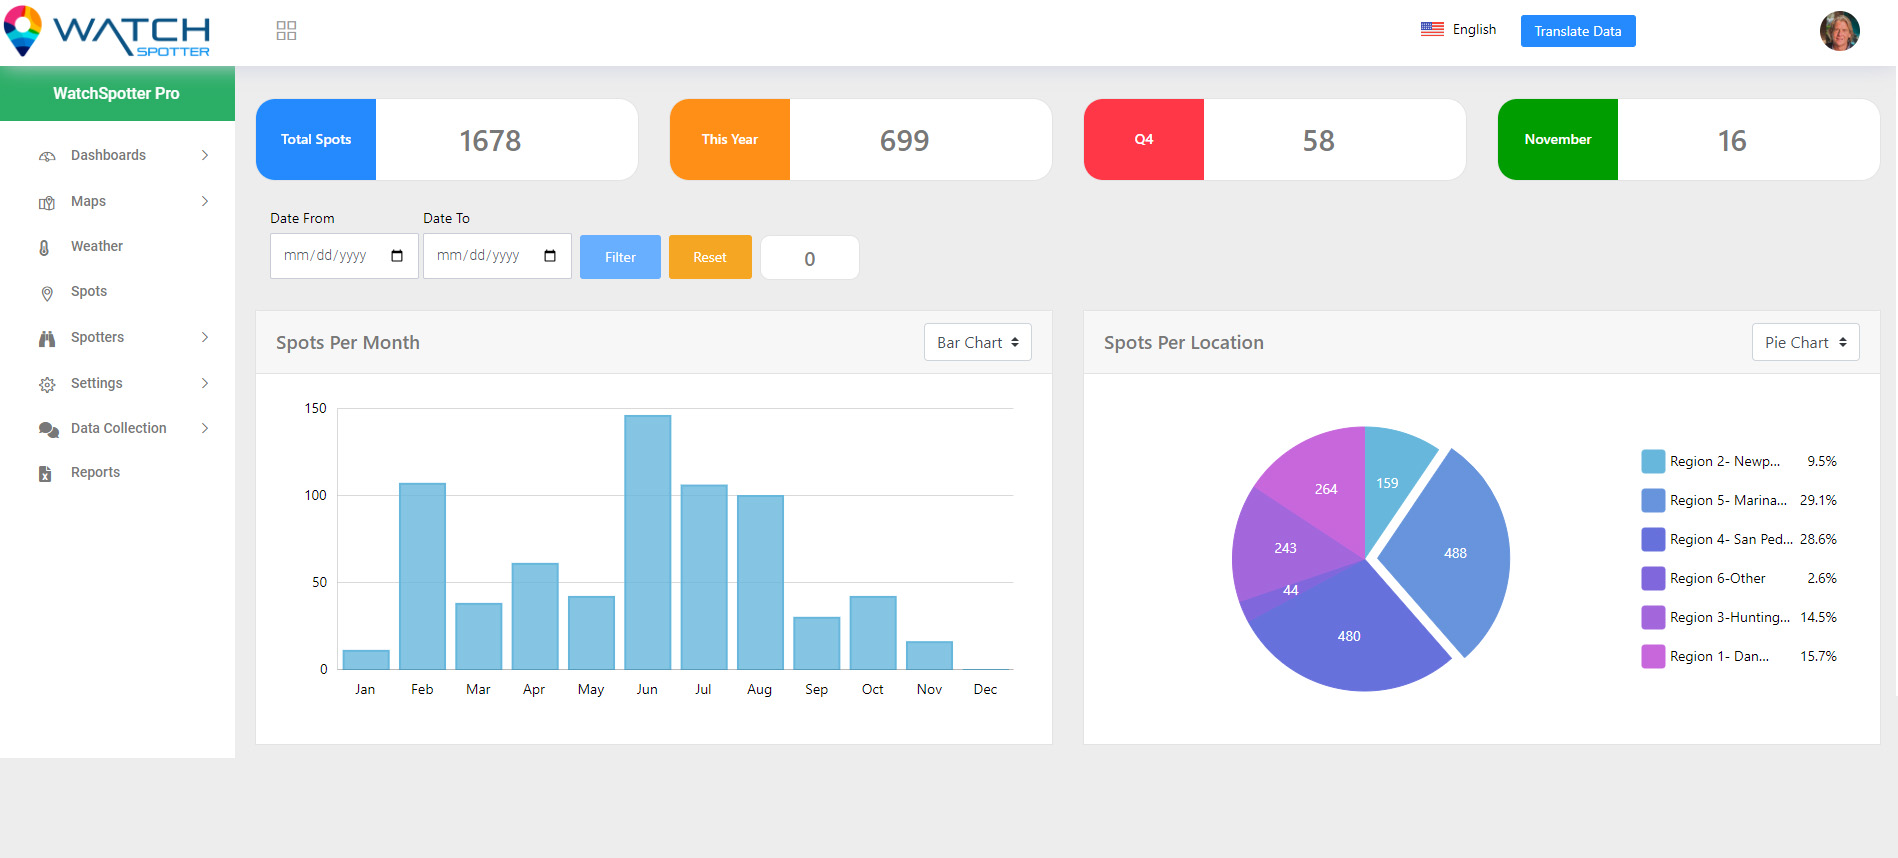
Unlock a deeper comprehension of your data through visualization tools that show trends, relationships, and spatial patterns, including emerging hot spots within your dataset. Our platform automatically generates insightful analytics charts and graphs for each data point, providing a rich, visual narrative of your information and fostering enhanced data-driven decisions.
Shareable Maps
Our system ensures that every sighting is captured and visualized on interactive maps as it occurs, offering a variety of map styles—such as satellite imagery, light and dark themes, general outdoor, heat maps, and bathymetric views—to enhance data analysis. Each geo-marker on the map is interactive, providing access to detailed data, including photos, with a simple click, allowing for a shareable and comprehensive geographic view of your findings.
How It Works
To input sighting data into the system, users have the flexibility of using the mobile app, accessing the web portal, or importing data directly from pre-existing applications or datasets. Upon entry, these sightings are instantaneously plotted on a map, and relevant satellite weather information is integrated. The interactive map and the enriched data it contains can then be easily shared with others. Moreover, for additional analysis, all the data captured can be exported seamlessly.
01
Research Sightings
Observational records and image documentation can be gathered through an online platform or mobile app. As soon as information is uploaded from the field, it becomes instantly accessible in real-time within the administrative portal.
02
Data Import
The system allows for the importing of pre-existing data, ensuring that you can begin your work with a full data set already in place. This feature facilitates a seamless integration process, enabling you to merge new insights with historical data effortlessly.
03
Mapping
As field data is collected and submitted, it is instantly enhanced with the latest global and marine weather information for each recorded sighting, providing a detailed context for each observation. Sightings are then plotted on a map as they occur in real time.
04
Analytics Reports
Our platform offers an advanced analytics suite that automatically generates a comprehensive array of charts and graphs for every data point collected. These visual analytics are readily accessible on your personalized dashboard, providing an at-a-glance understanding of data trends and patterns.
Popular Use Cases

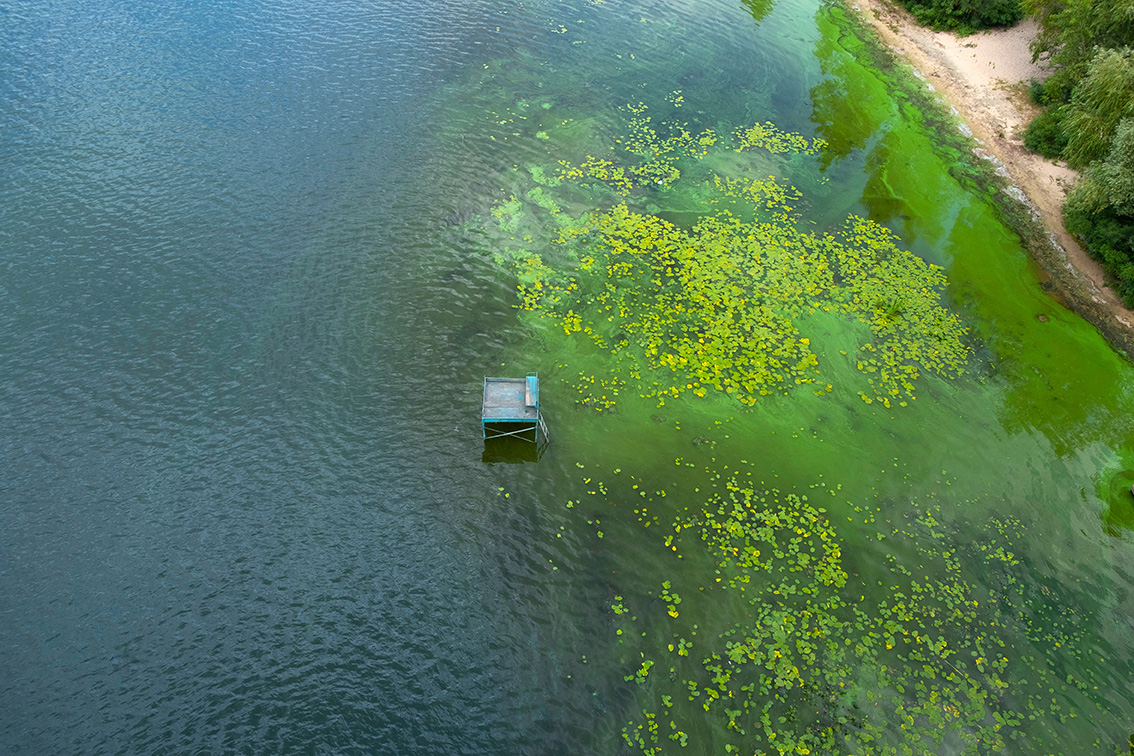
Algae Monitoring
WatchSpotter, along with the use of a portable field microscope, enhances the data collection process for monitoring algal blooms at sampled locations.
Accurate and comprehensive data collection is essential for studying and understanding various aspects of algae species, algal blooms, and their ecological impact. Combining a field microscope from WatchSpotter with our data collection platform can greatly enhance the research process by enabling real-time data collection, algae analysis, and collaboration.

Sea Turtle Nesting Surveys
Citizen Science has emerged as a popular, rapid, and cost-effective approach for gathering targeted data sets for research purposes. As funding for environmental science becomes increasingly scarce, having more people in the field with an eye on ecological developments is essential. Whether your research is focused on marine science, environmental science, ecology, or statistics, WatchSpotter can help you achieve your goals by providing the required spatial, temporal, photographic, acoustic, environmental, or other metadata, all while saving you time and money.

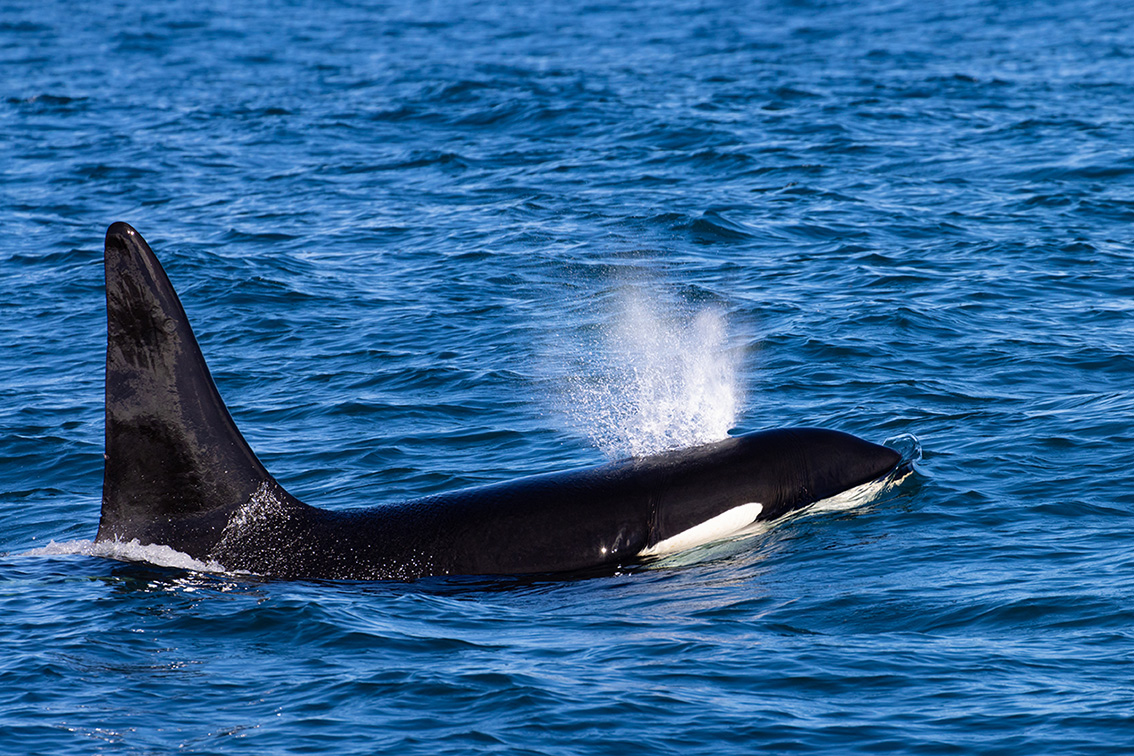
Marine Mammal Research
Simply and systematically collect data while on survey or opportunistically. Gain a better and more complete understanding of population dynamics, health, behavior, and ecology of your species of interest. Whether you are conducting photo id analysis on a local dolphin population, long-term monitoring of migratory whales, birds, or butterflies, tracking and tagging endangered species, monitoring mammals, reptiles, birds or amphibians for emerging diseases or anthropogenic stressors, or protecting animals from poachers or other illegal hunting, WatchSpotter offers a solution that is customizable to fit the specific research questions of your project.


